Cleaning AI-extracted investment data at scale
Opto Investments
Problem
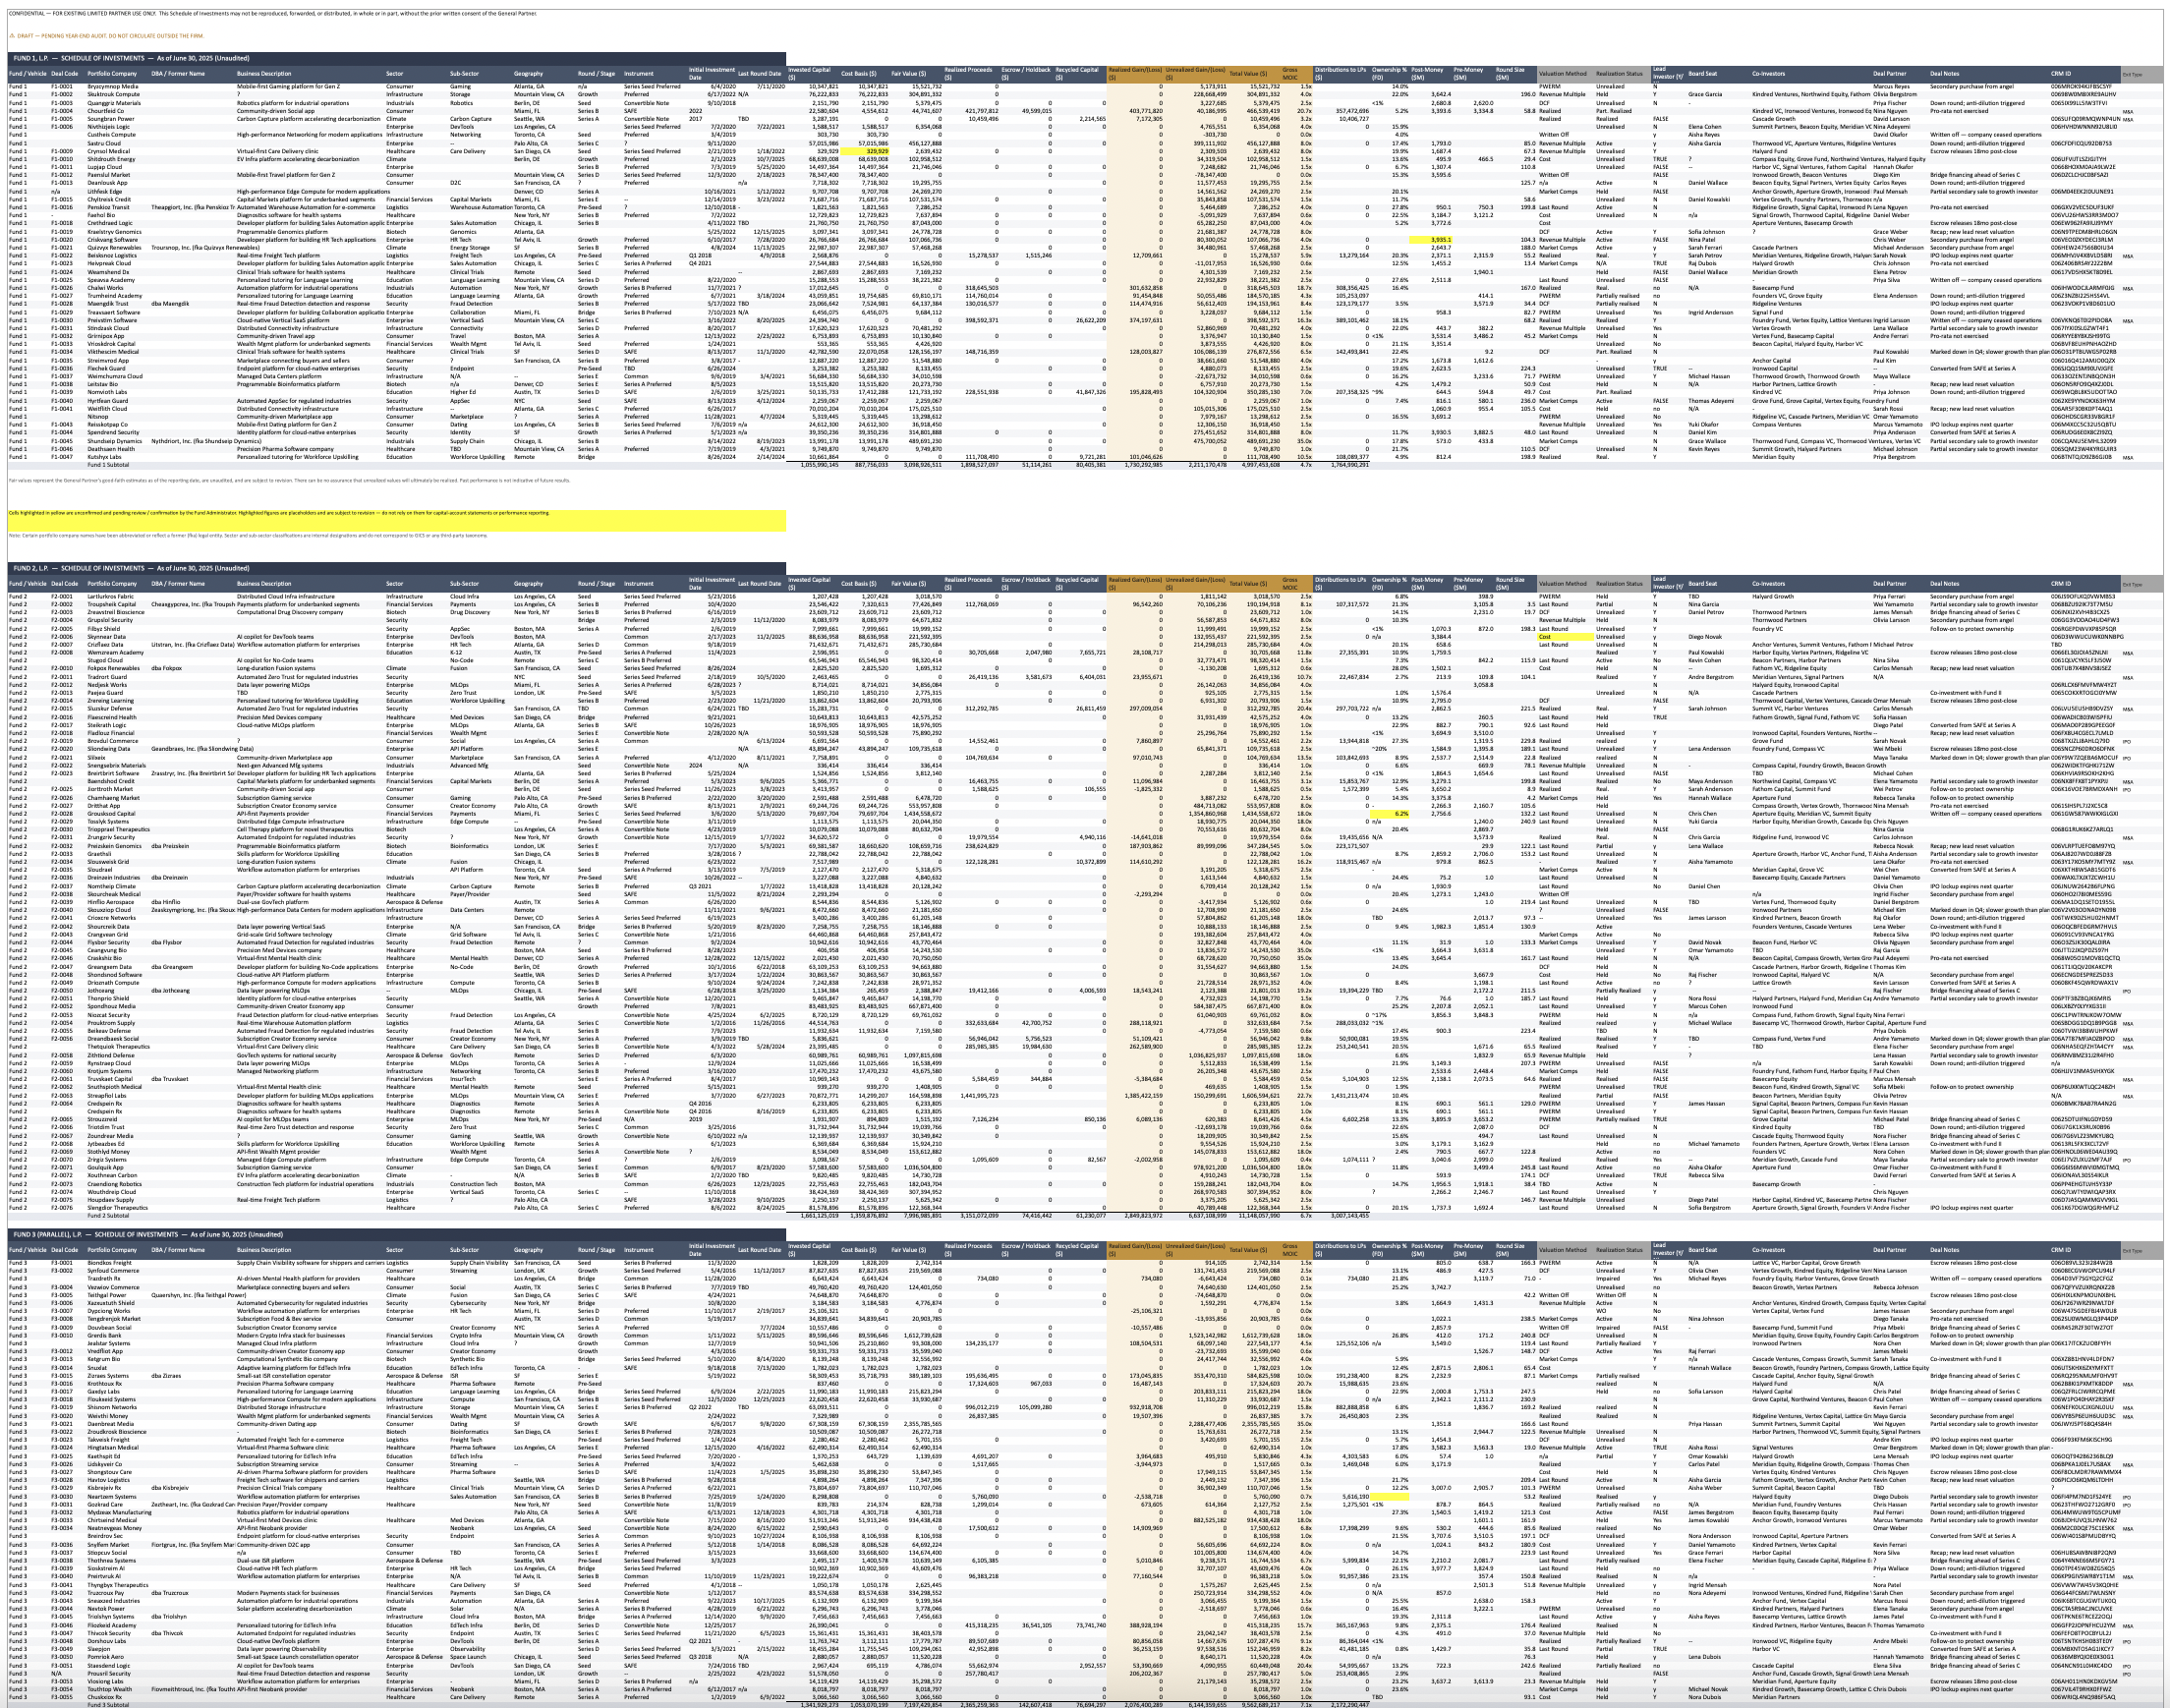
A schedule of investments (SOI) is a snapshot of a fund's holdings: which companies it has invested in, at what cost, and what those positions are currently worth. In the Opto platform, SOI data powers fund analysis in a diligence tool for external users. Getting this data into the system accurately is a prerequisite for the product to function.
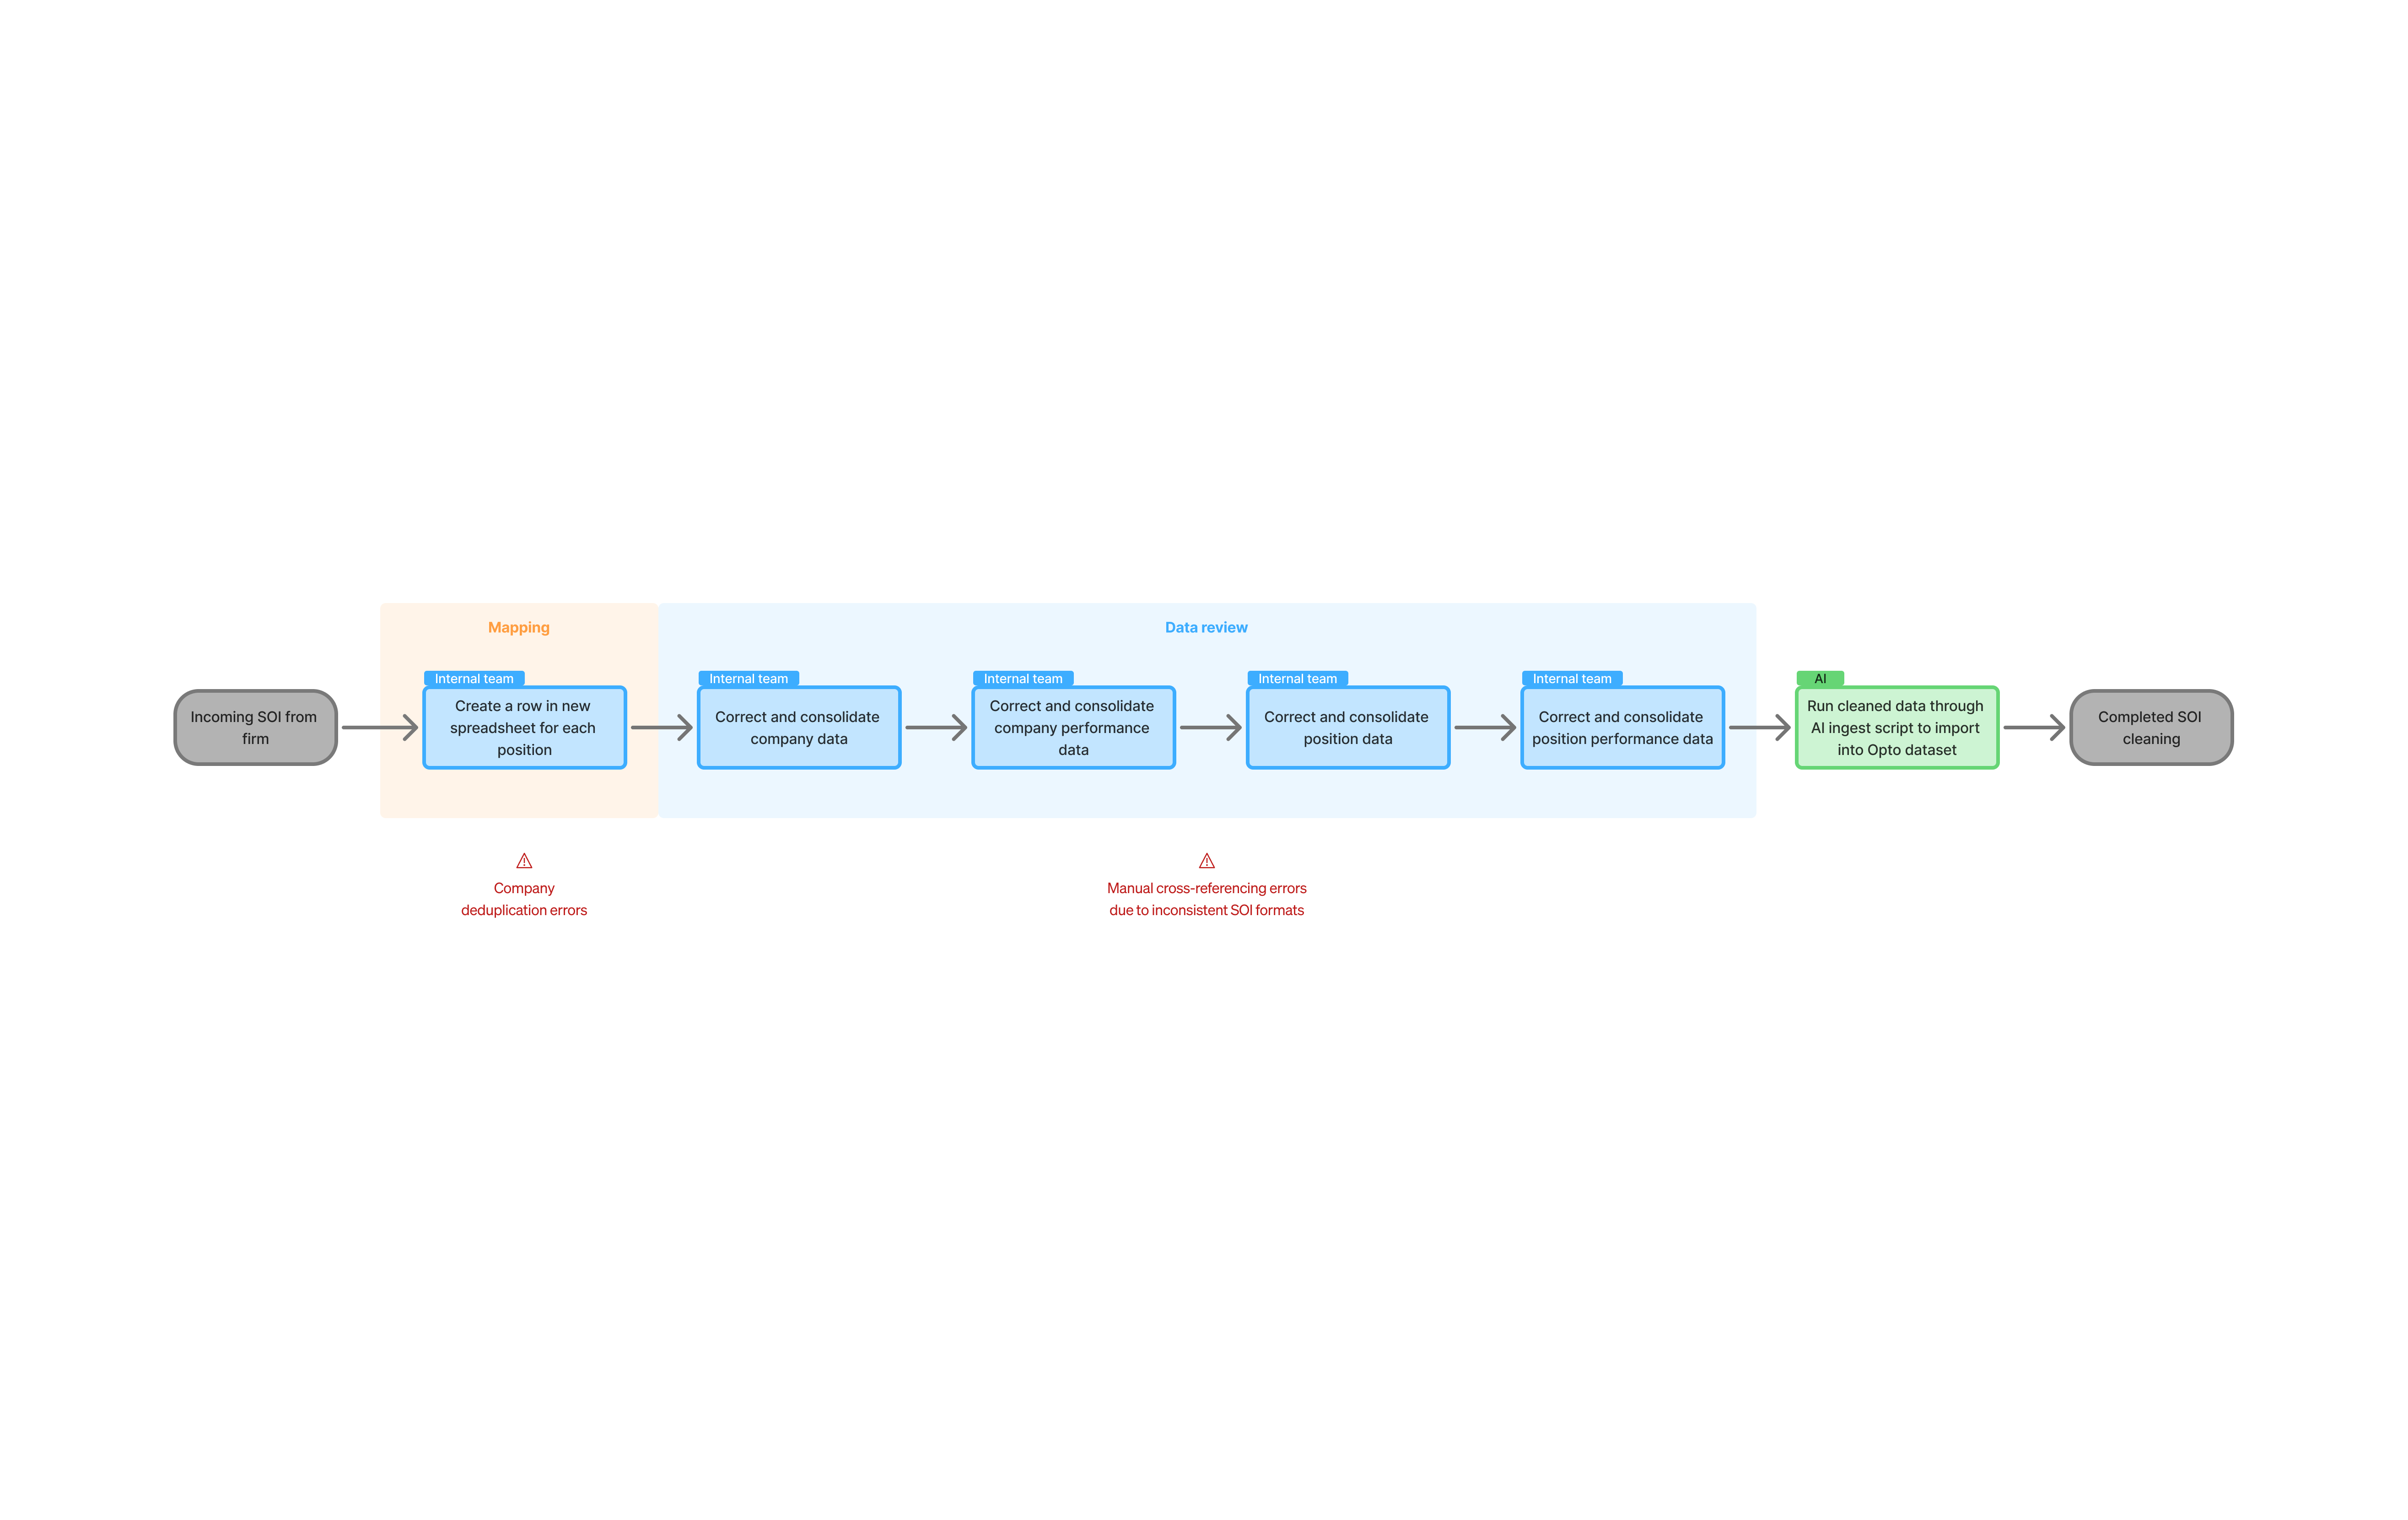
The existing process for extracting SOI data was manual and time-intensive. To fit Opto's data model, raw SOIs—some containing 100+ companies—must be verified across multiple hierarchical data levels, checked column-by-column against the source document. Data volume quickly outpaced the internal team's capacity to process it. Turnaround was 6+ hours per SOI and didn't scale with growing client demand.
Discovery
My interviews with the team doing this manual work daily revealed two key friction points:
1. Deduplication is fragile. Companies sometimes need to be merged. Getting this wrong creates downstream data issues. For subsequent SOIs from the same firm, no automated solution existed to reliably resolve discrepancies.
2. Comparison at scale is exhausting. Every SOI has firm-specific nuances, such as unique formatting and inconsistent naming, making cross-referencing against source material slow and error-prone. The team was mentally holding context between documents.
Company mapping
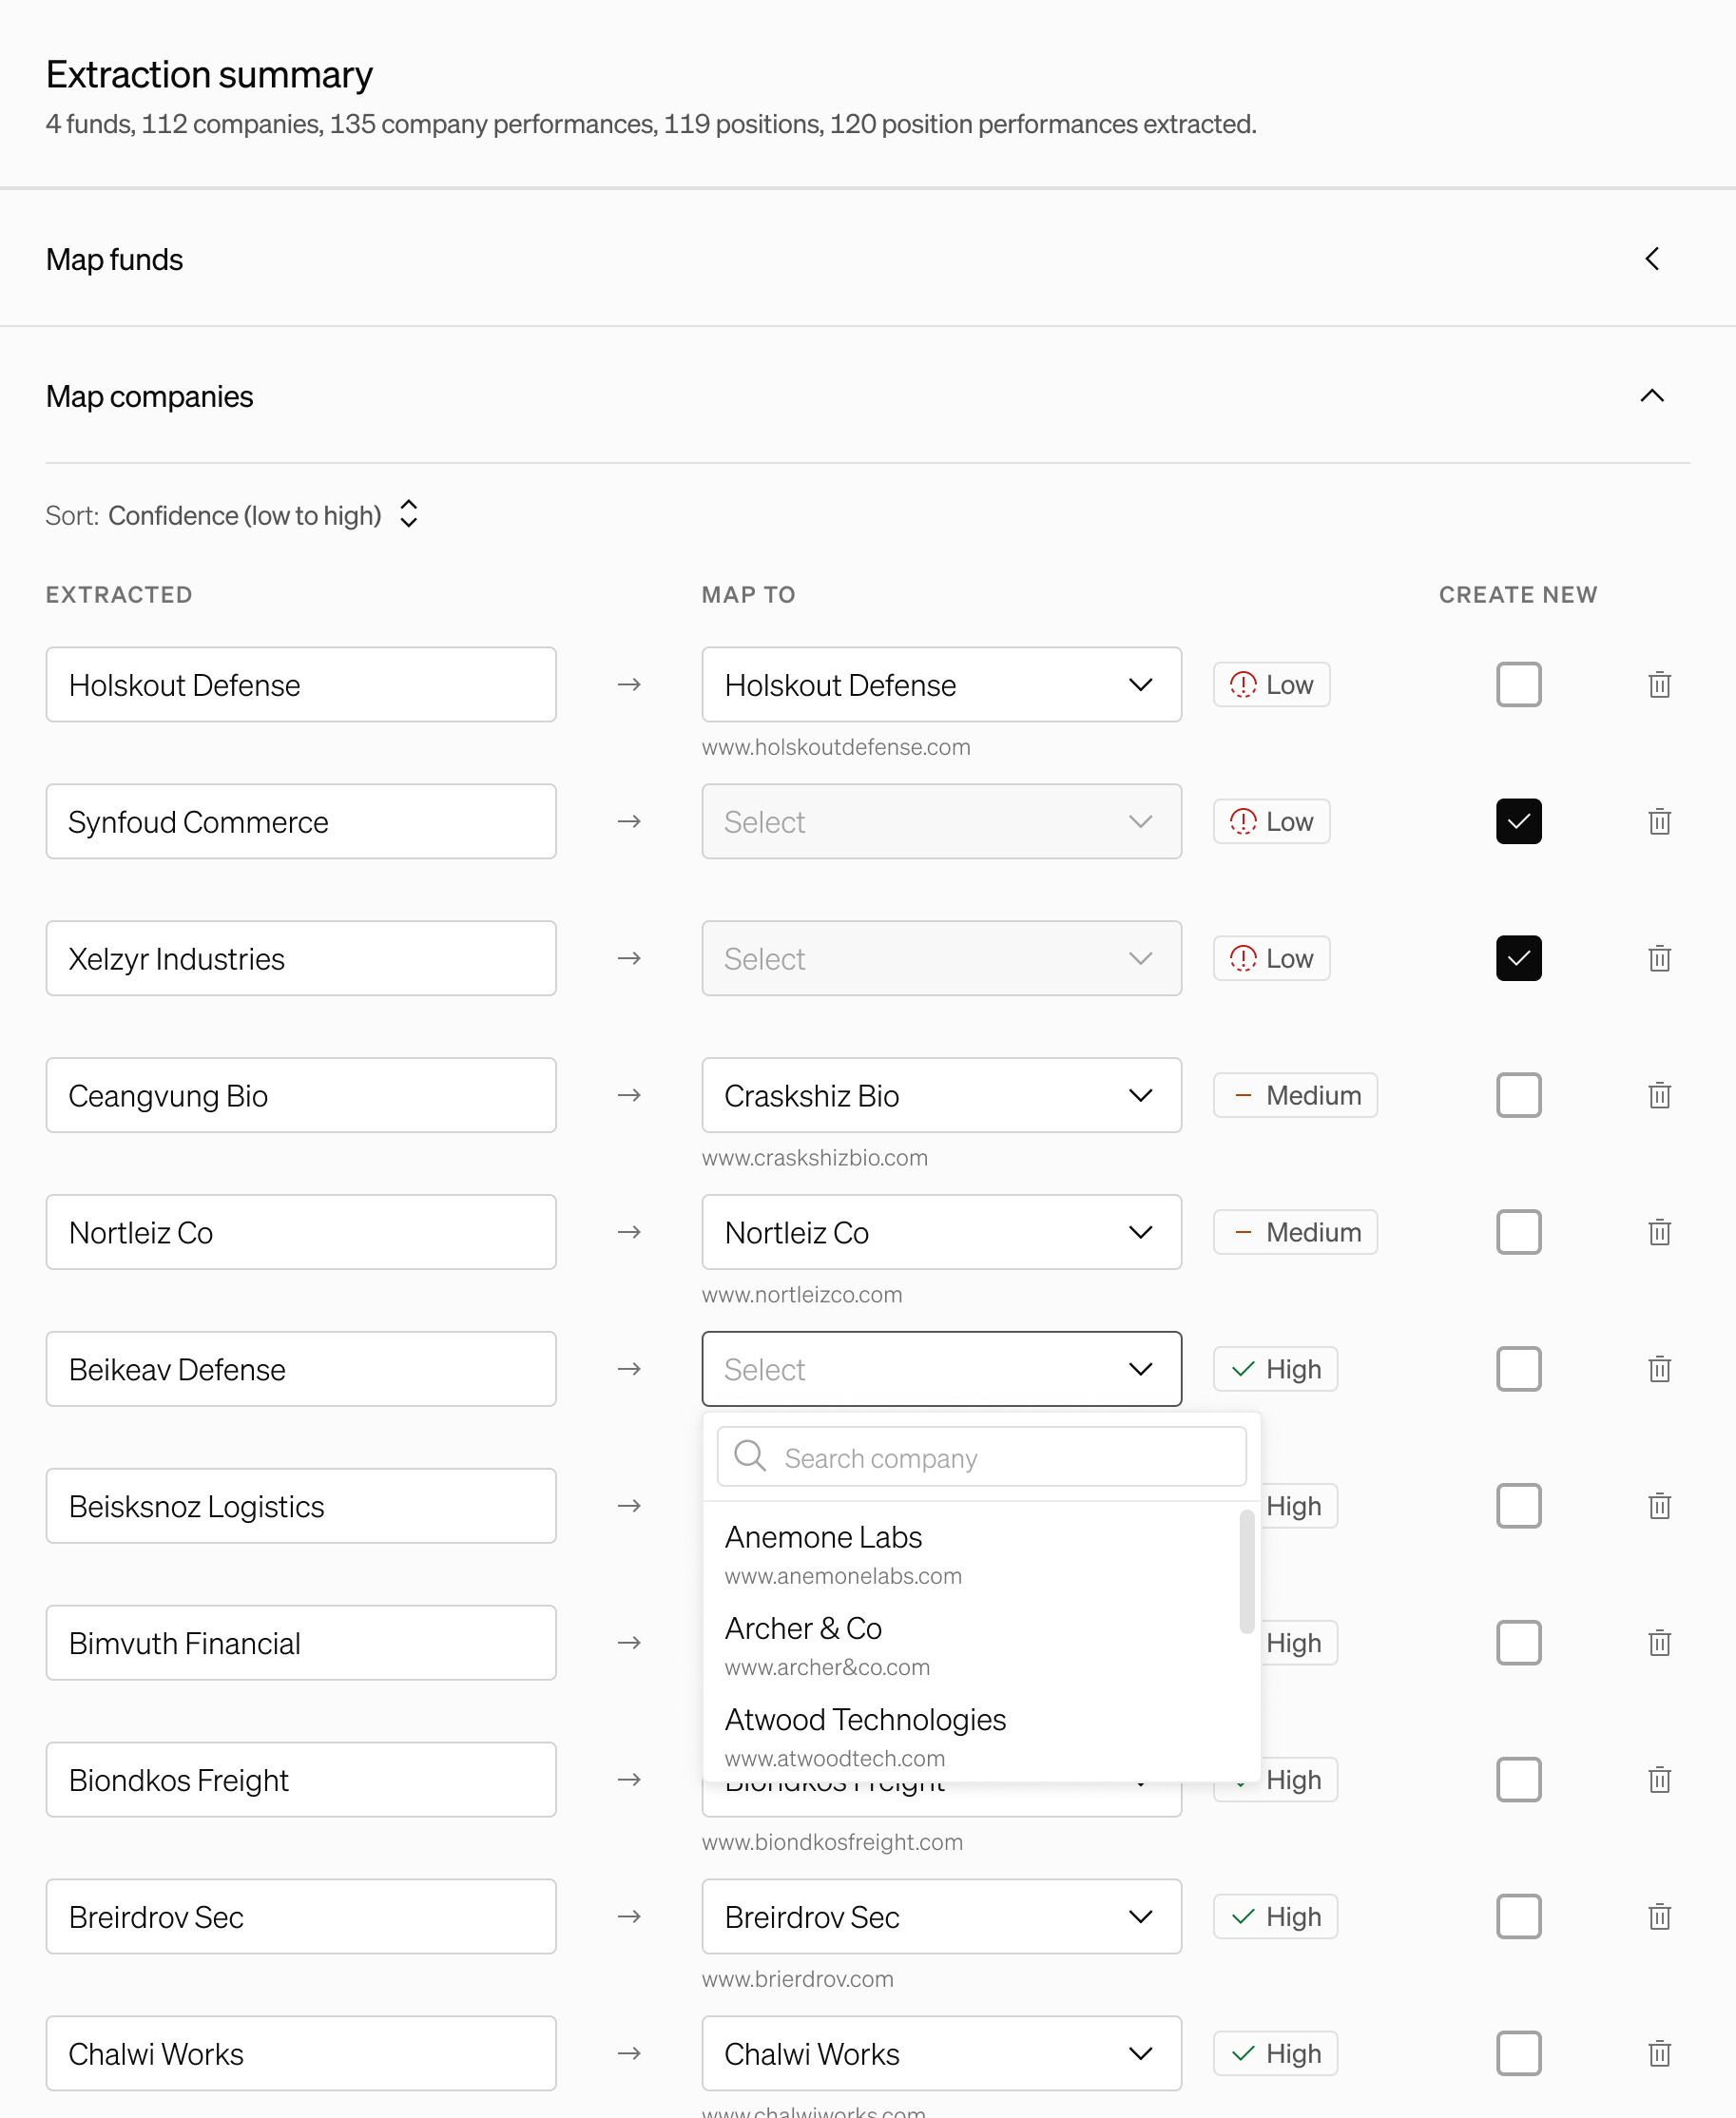
This tool was designed hand-in-hand with a new AI extraction step. SOIs now ran through a first-pass AI extraction before reaching the team's hands, which shifted the team's task from manual entry to verification.
The team first verified the mapping of extracted companies to the firm's existing records. Fuzzy matching and confidence scores surfaced potential duplicates that exact matching could miss and front-loaded ambiguous matches. Early feedback revealed false positives from name similarity, so company website was added as a secondary verification signal. What previously required manual search and reference became a single screen with most matches pre-resolved. The team just confirmed, merged duplicates, or overrode.
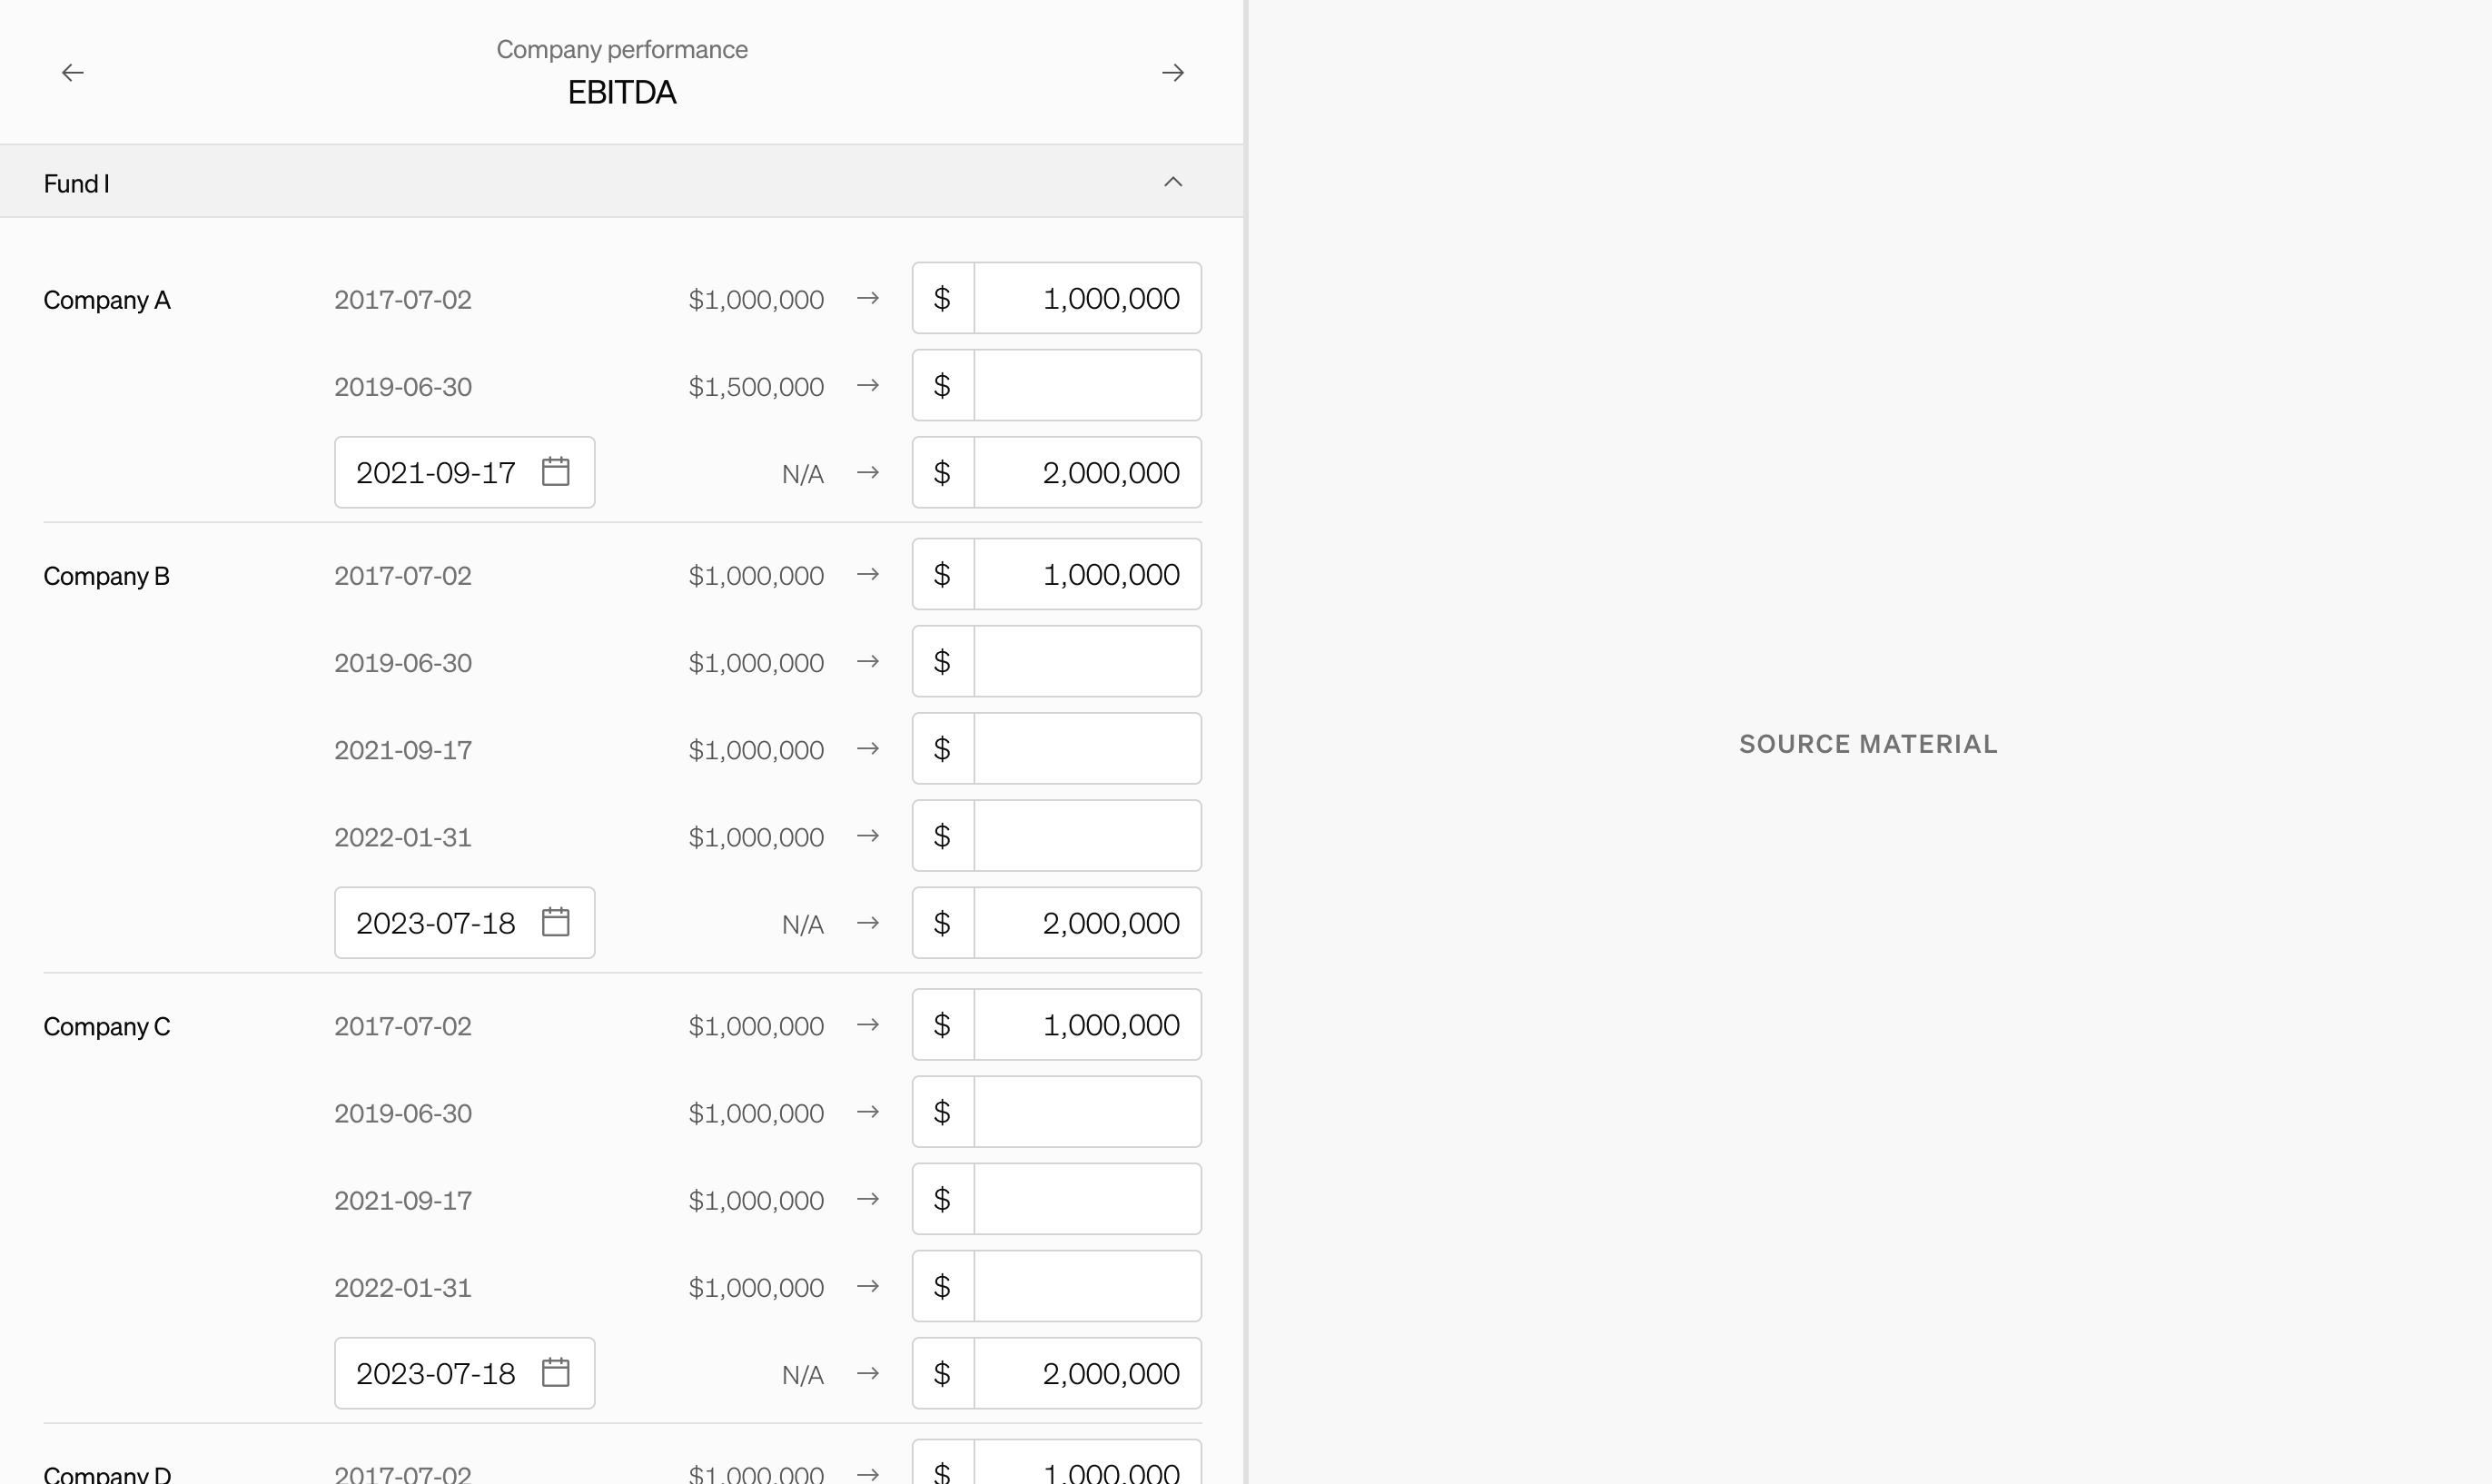 Option 1: field-by-field
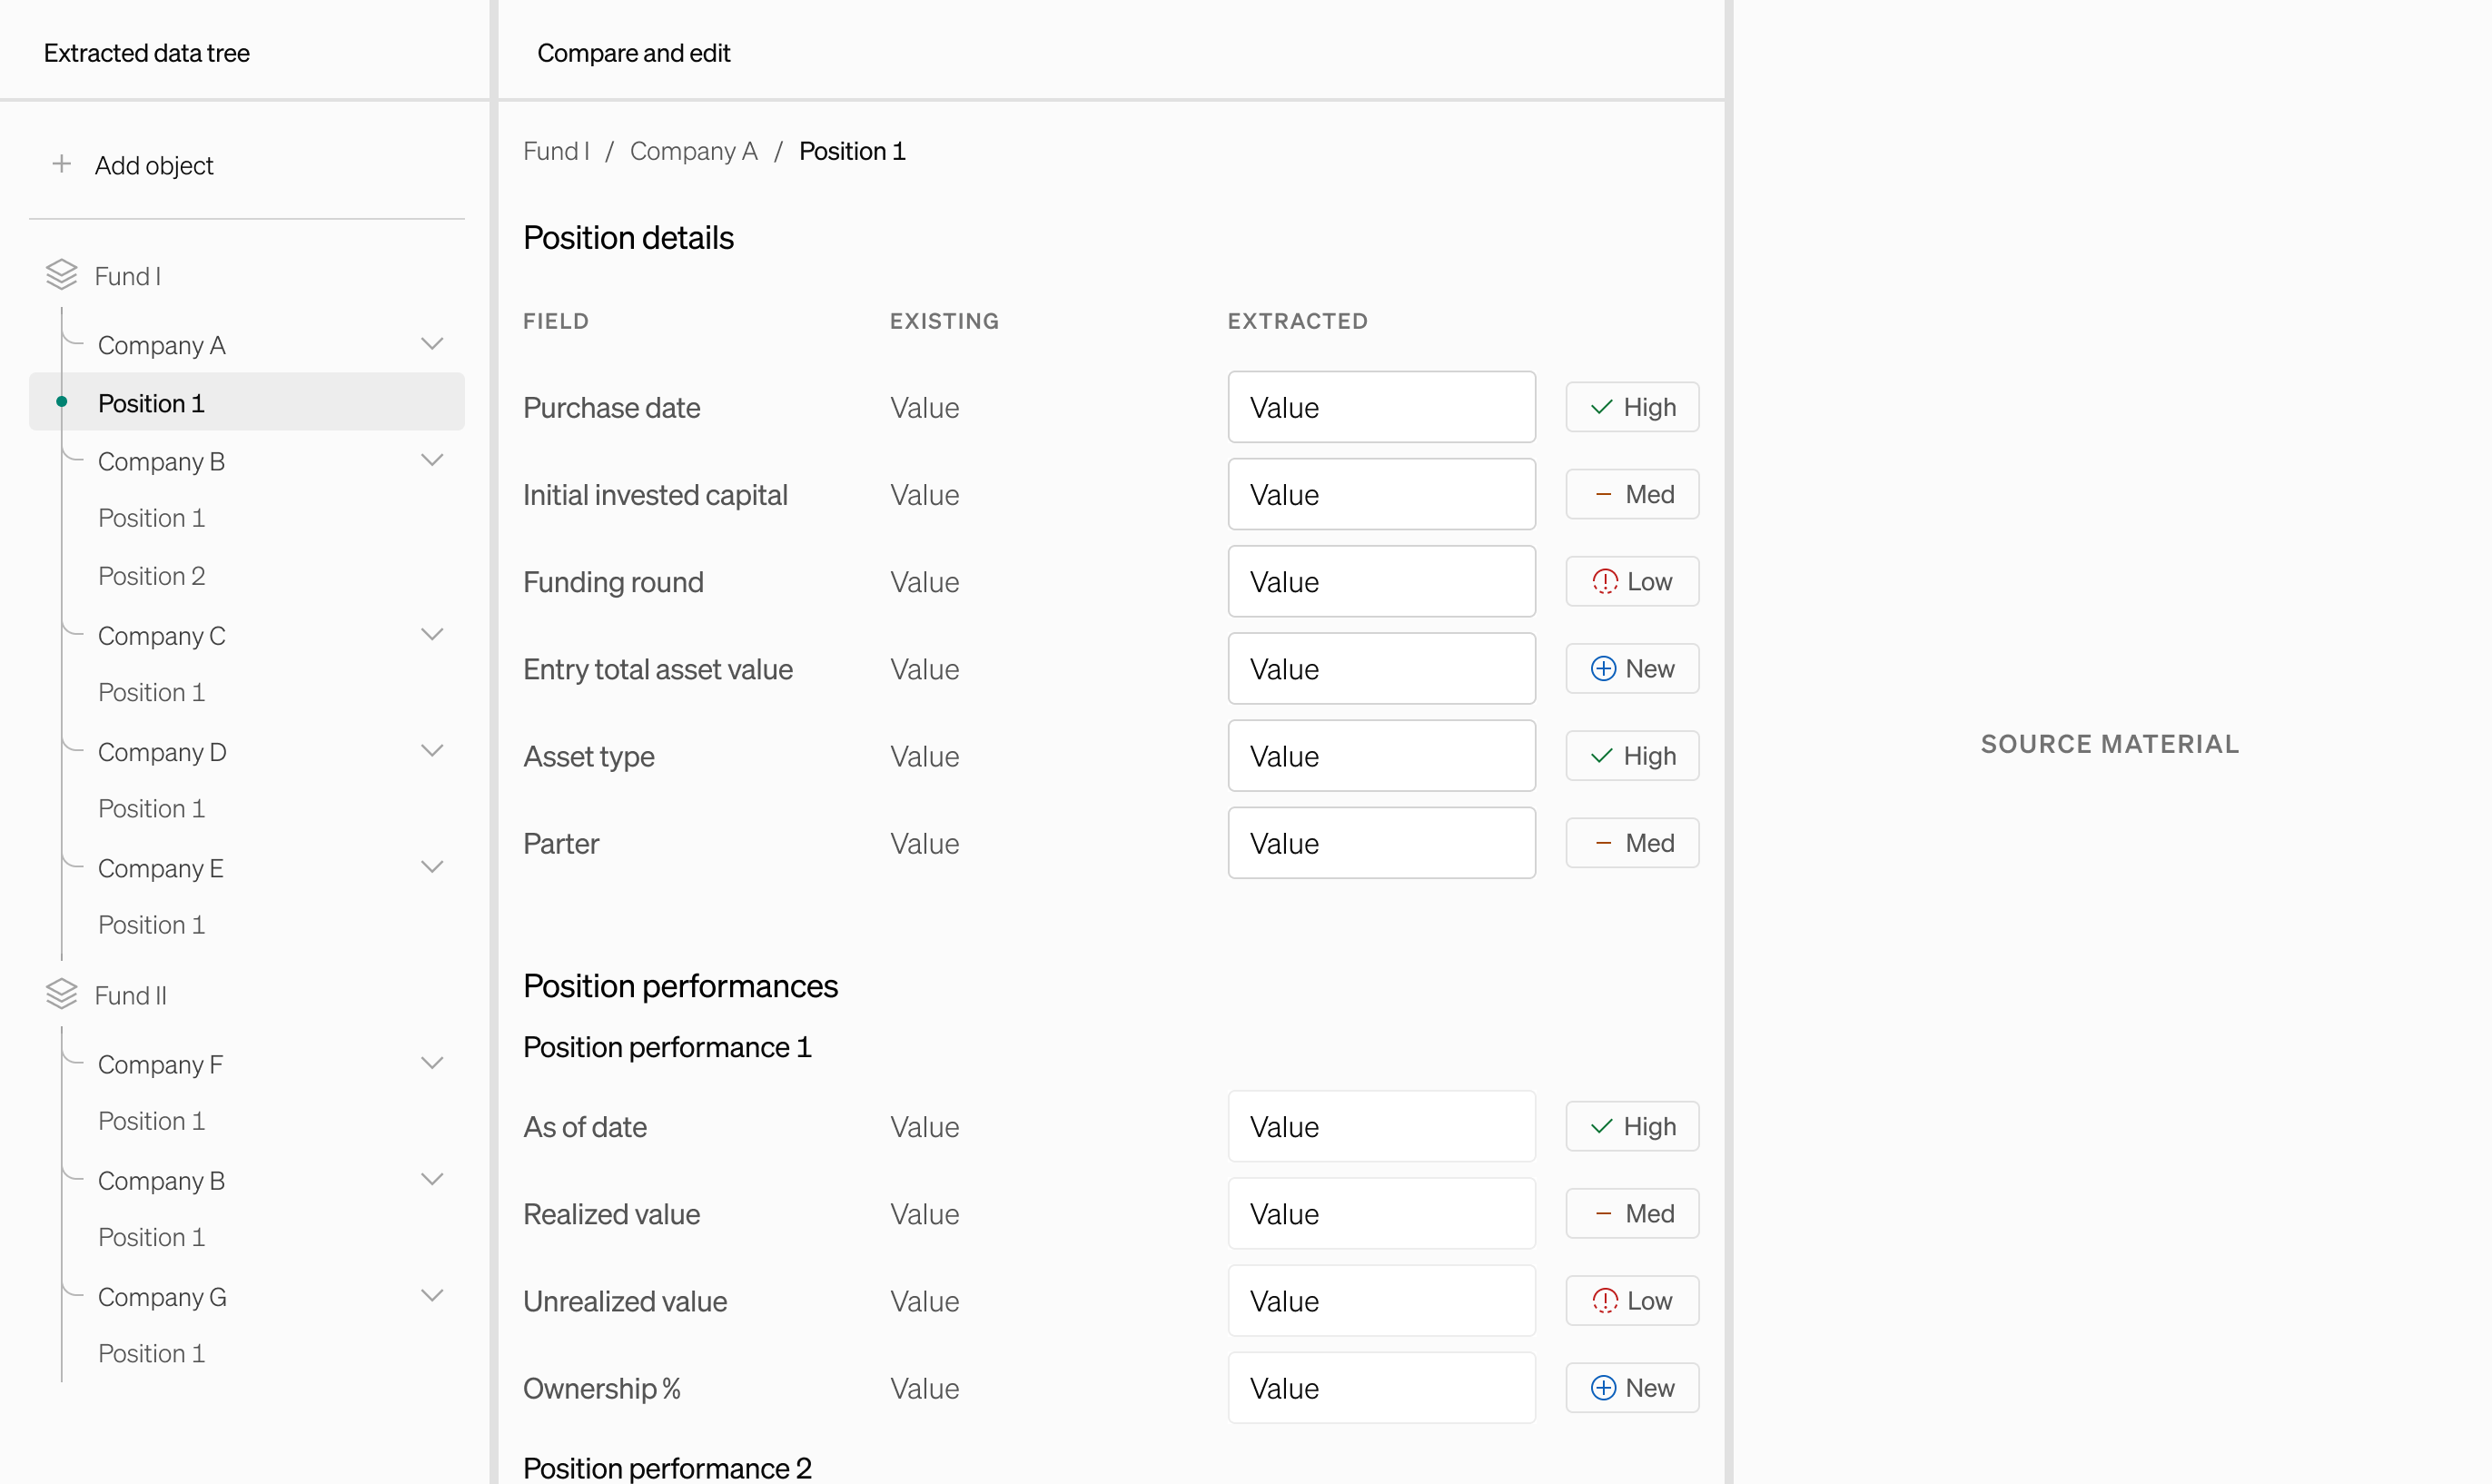 Option 2: object-level navigation
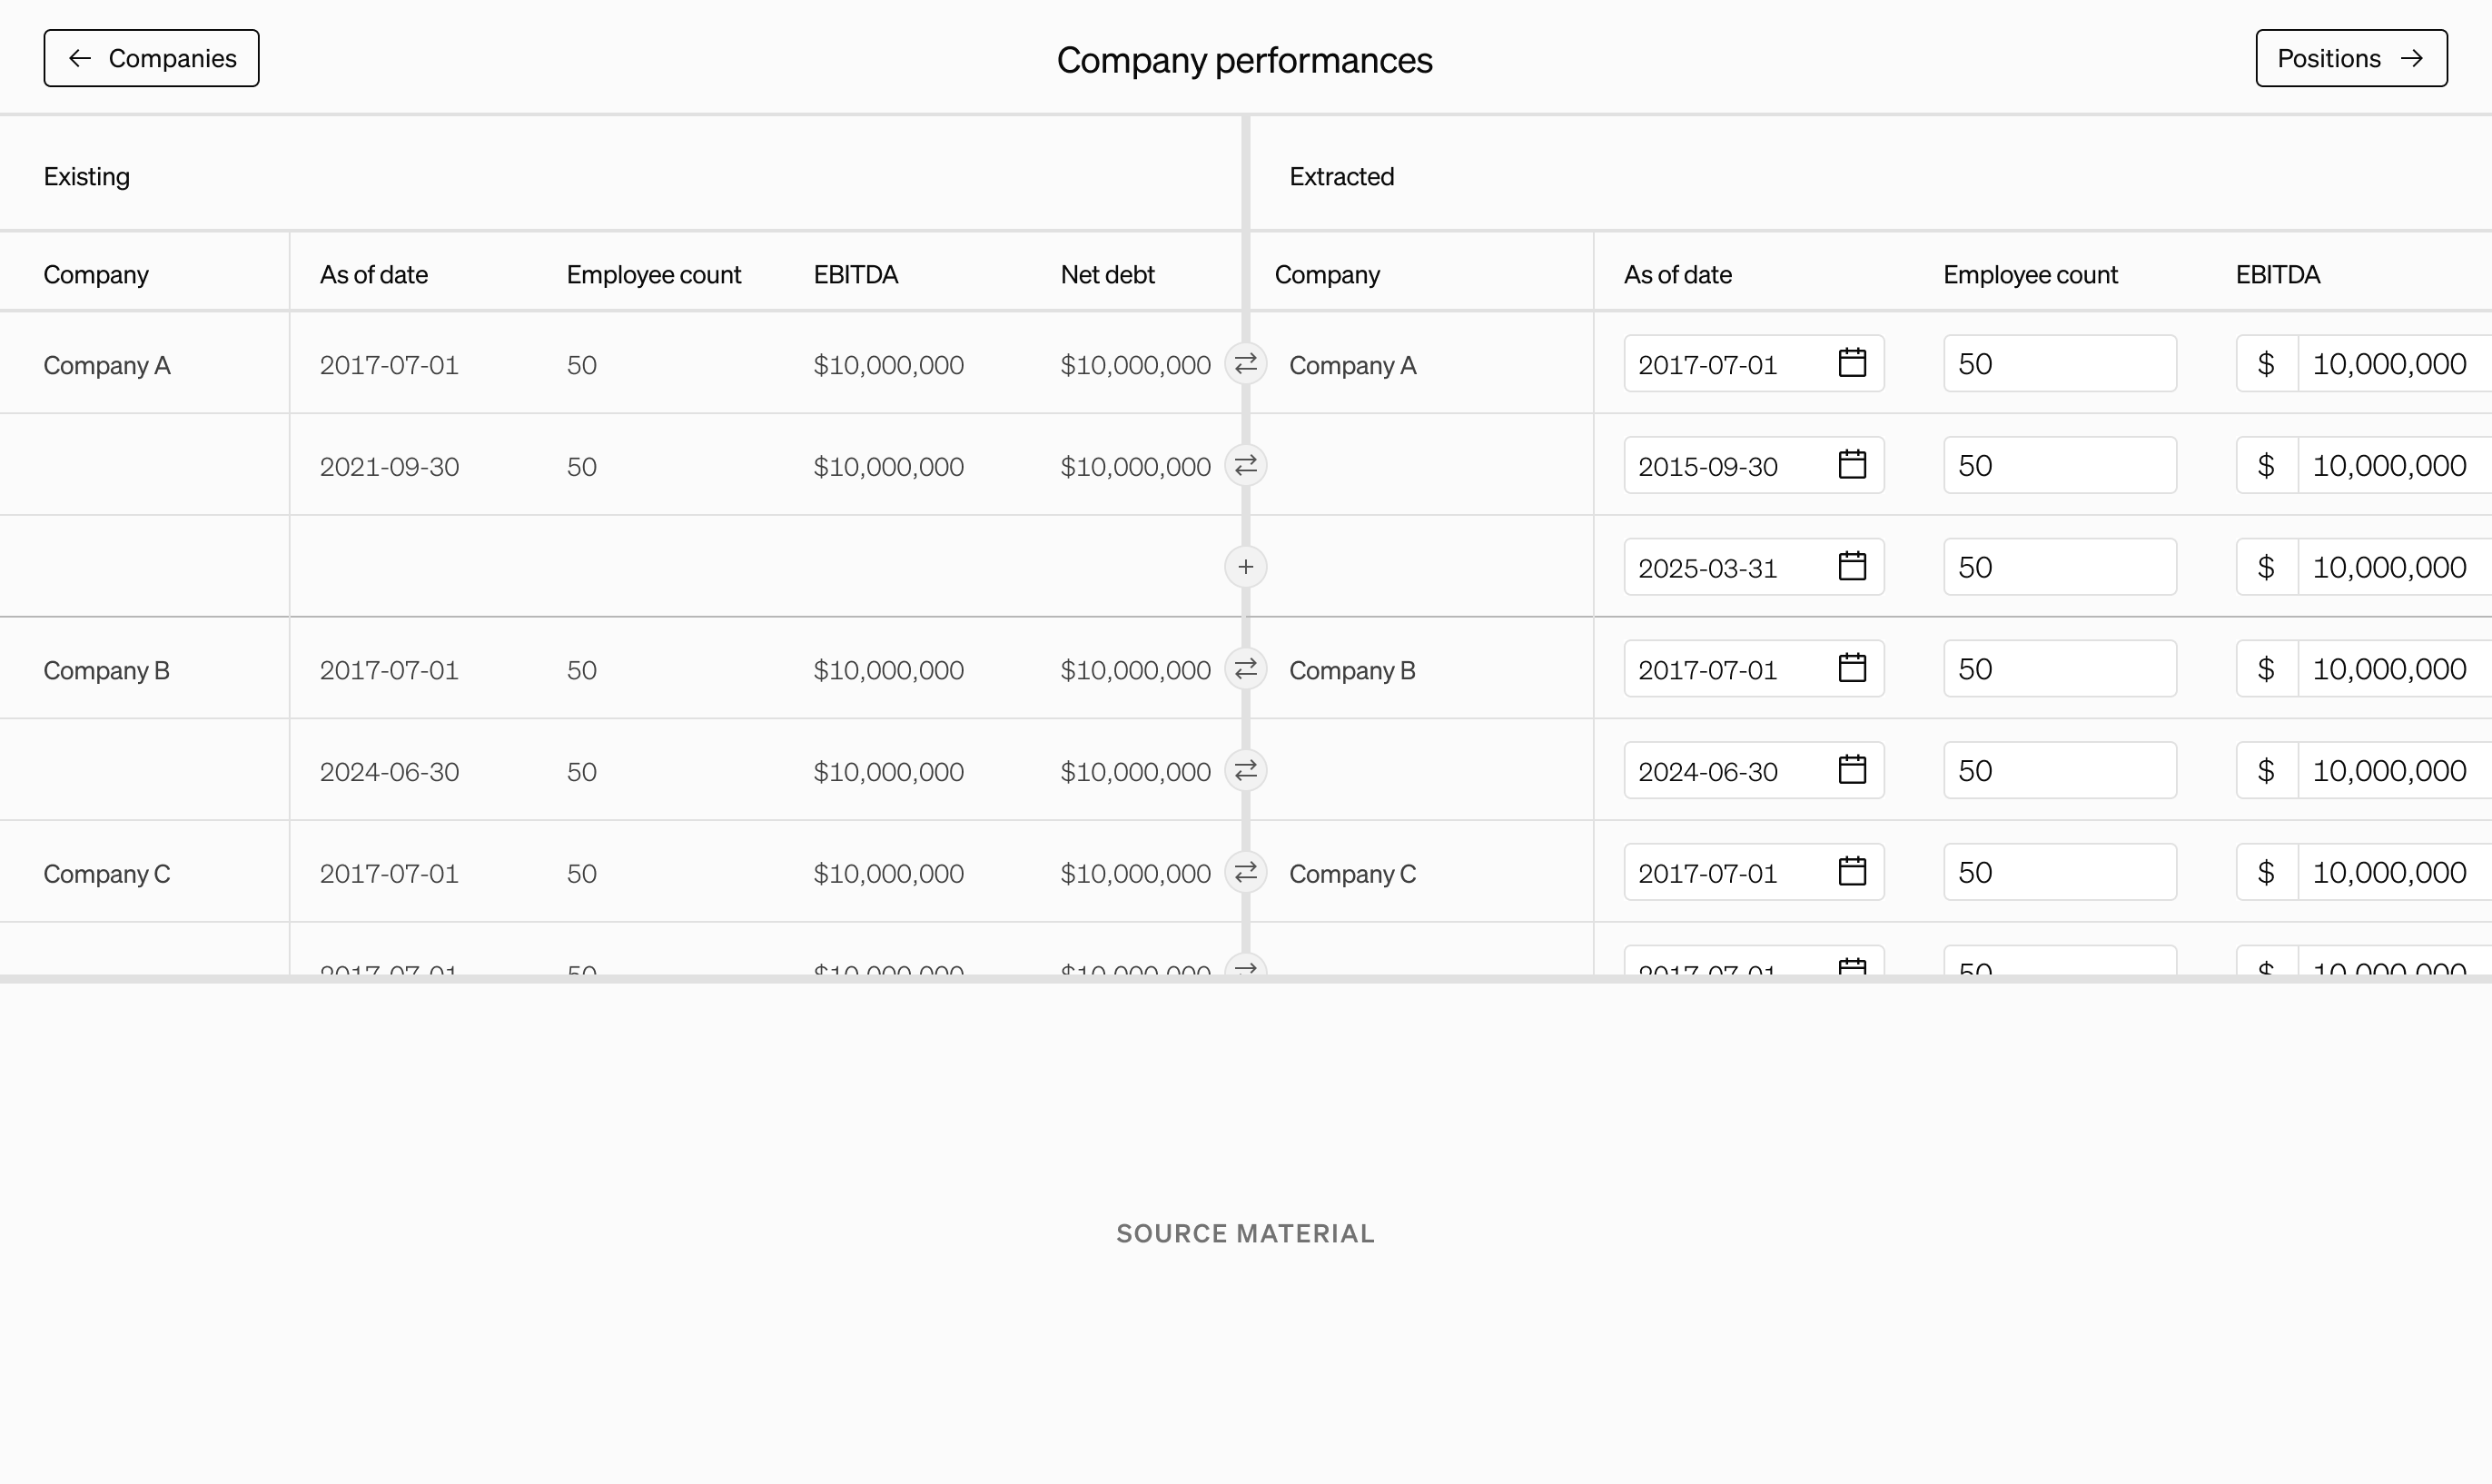 Option 3: tabular side-by-side
Data review
With companies mapped, the team moved into reviewing the extracted company data. I explored three layout directions to satisfy the core tension of enabling fast, column-by-column review at scale without sacrificing accuracy needed to catch AI errors.
1. Field-by-field. One field at a time. Lowest cognitive load per decision, but impractical at scale. Reviewing 100+ companies one data point at a time is too slow to meet turnaround targets.
2. Object-level navigation. Data tree on the left for structural awareness, center pane for comparing existing vs. extracted, and a source viewer on the right. The field-level rows layout doesn't match how SOIs are structured, so the team would lose the familiar tabular format.
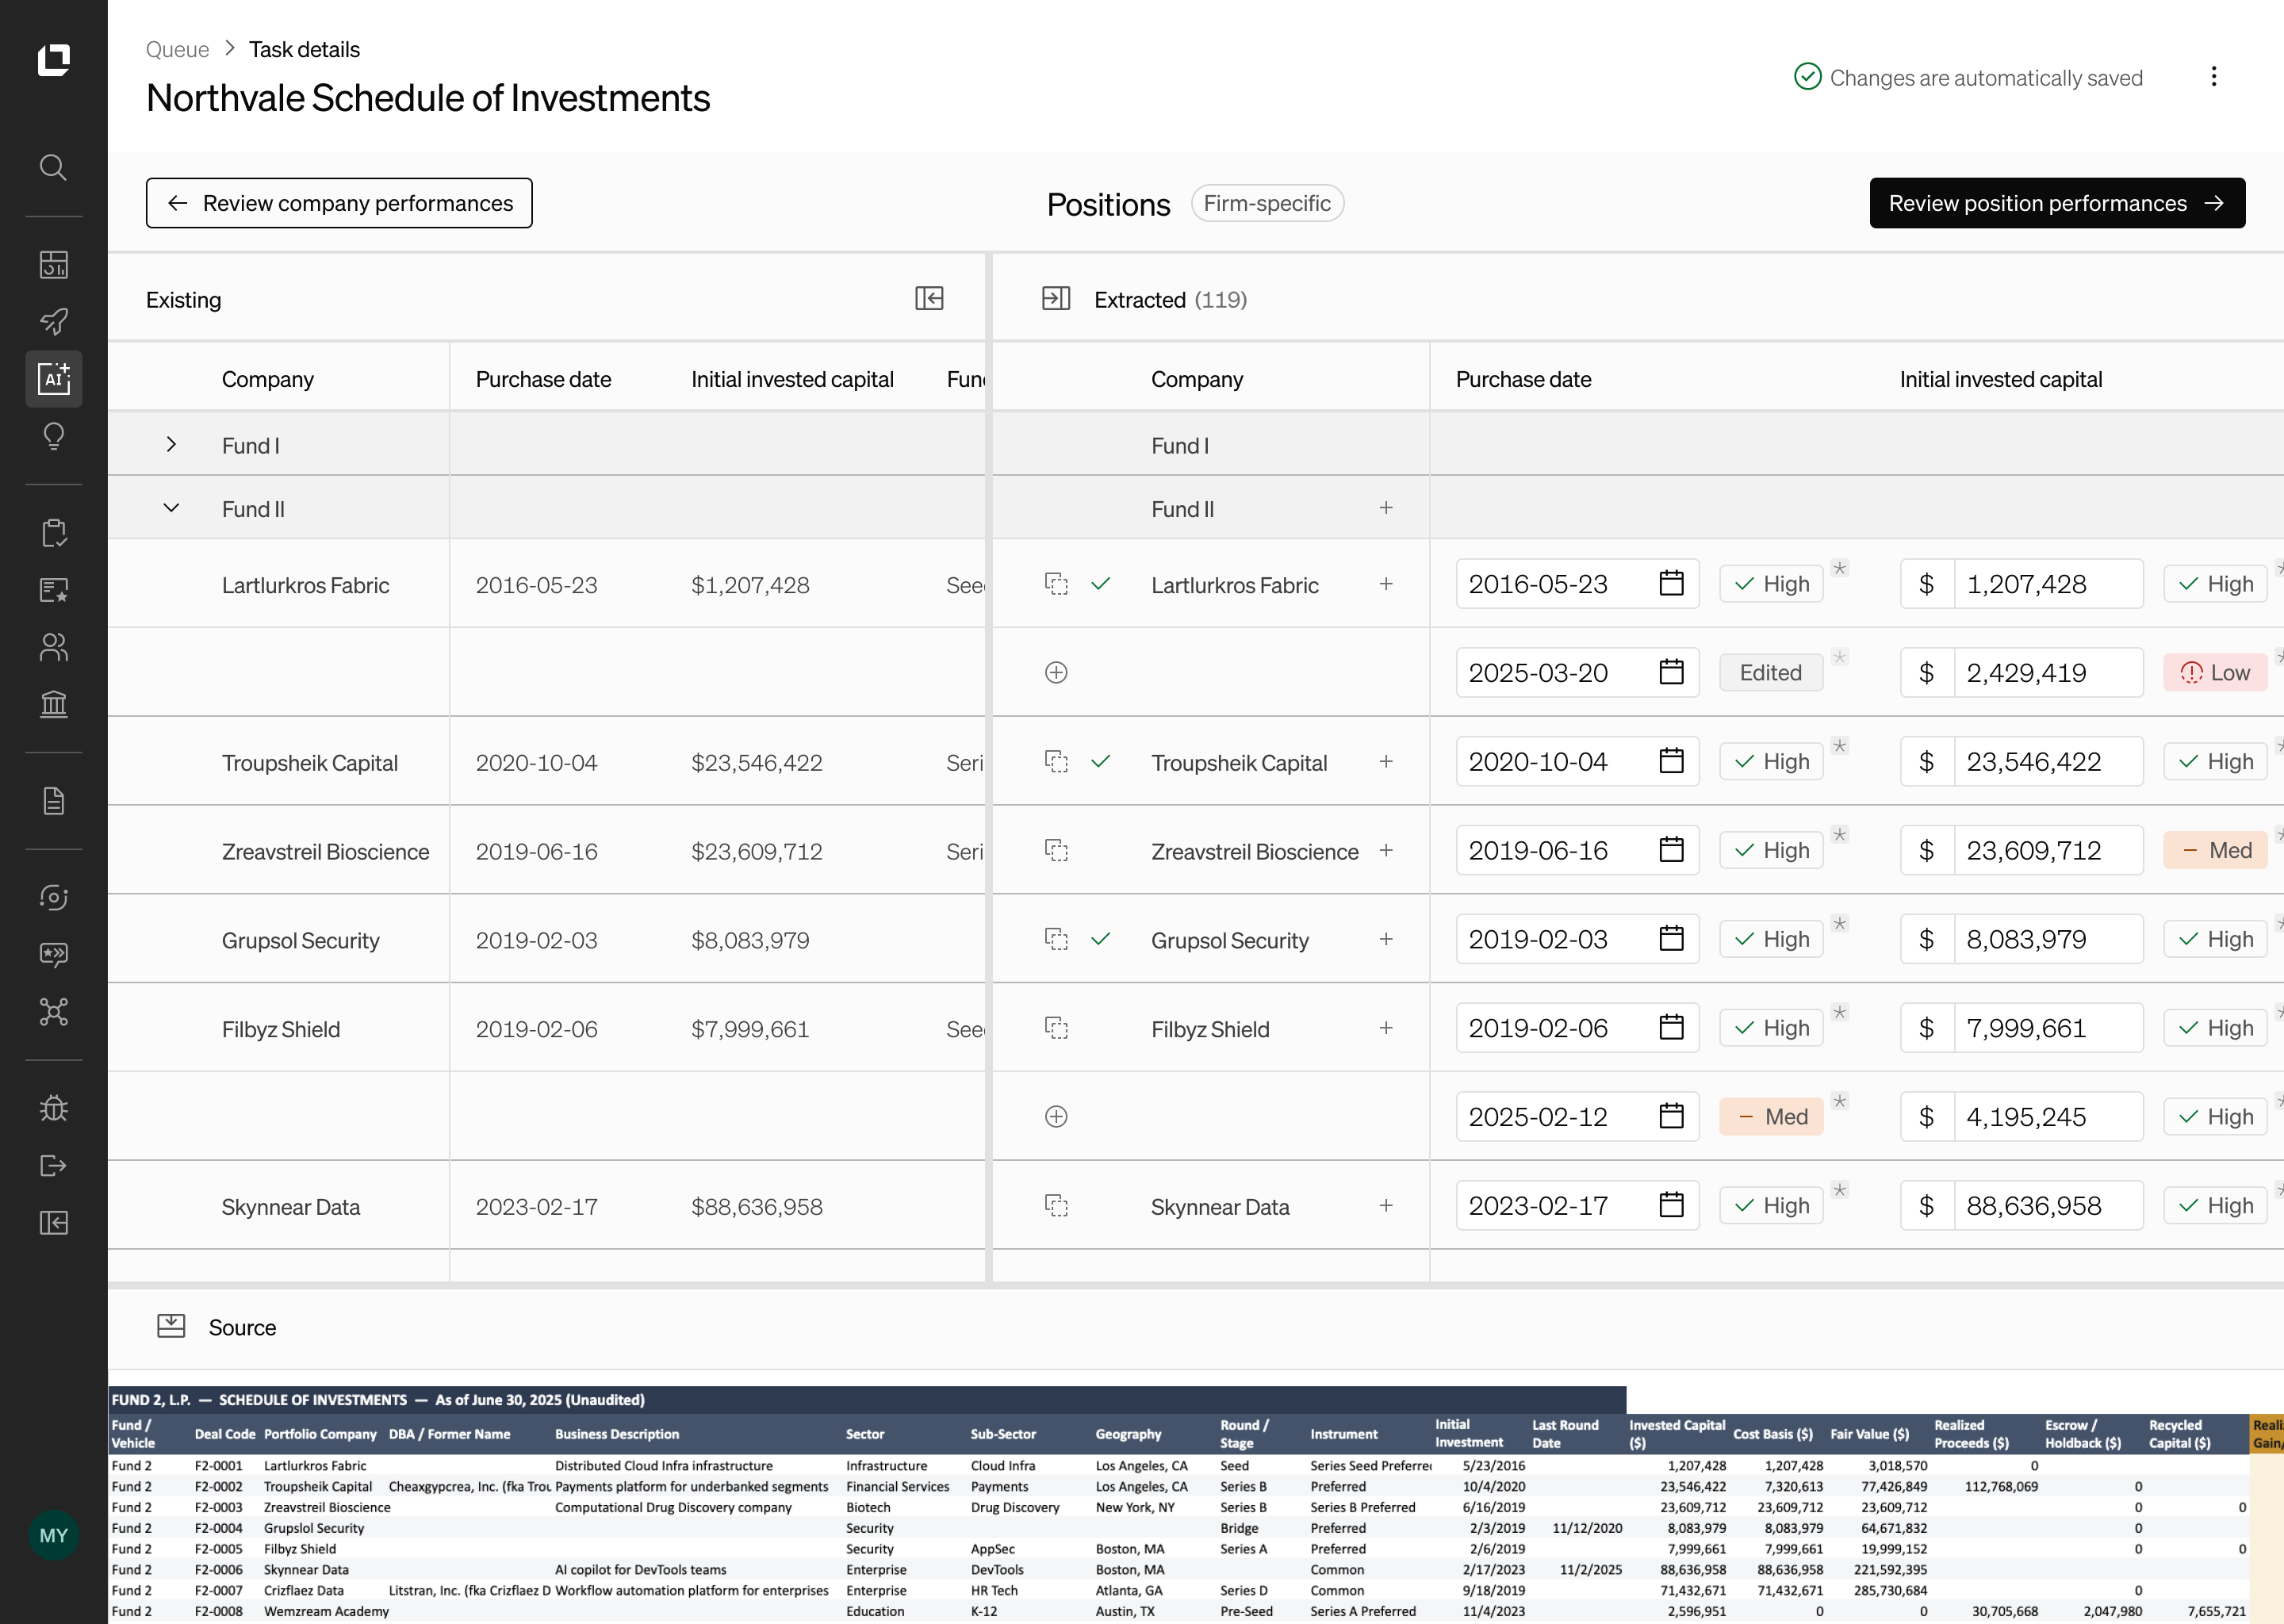
3. Tabular side-by-side (selected). Existing data on the left, extracted data on the right, source SOI on the bottom. Team members focus on one hierarchical data level before moving to the next to preserve dependencies (e.g. position performance data relies on accurate position data). This option mirrored how the team already worked—column by column with source beside spreadsheet—while adding the structure they lacked.
Solution
Every object in each data level has a corresponding row in both the existing and extracted panels. This avoids duplicates by consolidating matching data side by side. A status icon in the leftmost column of the extracted table indicates the relationship between rows: perfect match, match, new extracted object, or no match. Confidence badges per field focus the team's attention on medium and low scores, turning a full review into a targeted check. Data provenance attached to each field also provided instant verification against the source cell.
I considered a batch-approving experience by confidence level to focus attention on low-confidence rows, but reordering would break the row alignment needed to catch incorrect matches. Instead, confidence badges direct attention within the aligned layout rather than rearranging it.
Impact
The tool was adopted as the internal team's primary SOI workflow. Median turnaround dropped from 6+ hours to 2 hours. Faster SOI processing meant fund analysis data became available to end clients sooner, and the team could handle more SOIs without adding headcount.